Your responses are in!
You skip towards your survey’s Analyze tab and, almost immediately, you spot your Net Promoter® Score (NPS). Suddenly, you panic. You’re confused about how it was calculated and you don’t know whether the score is good or bad.
Worry not! You’ve landed on the right blog post. We’ll show you how the NPS is determined and answer the long-standing question “What is a good Net Promoter Score?” so that you can contextualise your rating with ease.
How the NPS is calculated
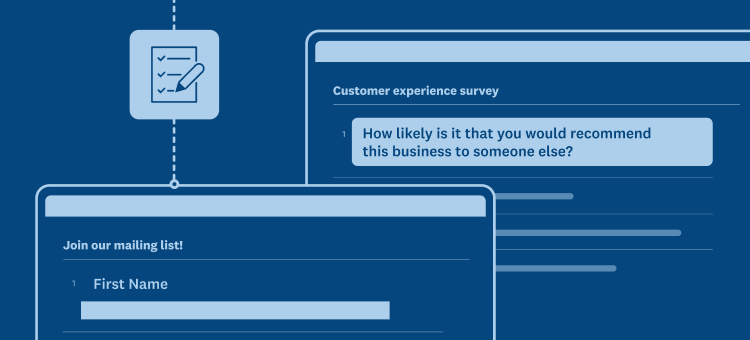
The Net Promoter Score is the world’s leading metric for measuring customer loyalty. It comes from the question “How likely is it that you would recommend (insert company or product/service) to a friend or colleague?”
The respondent is asked to select a rating on a 0-10 scale, with 0 being the least likely to recommend and 10 being the most likely. Once the responses come back, you segment each respondent into one of three groups, based on their rating: Promoters (9 or 10 rating), Passives (7 or 8 rating) and Detractors (0 to 6 rating).
You can then calculate your NPS using the following formula:
NPS = % of Promoters – % of Detractors
Note: You can get the percentage of Promoters by taking the total number of Promoters, dividing it by the number of respondents and multiplying the result by 100. You’d do the same to get the percentage of Detractors, except that you’d use the total number of Detractors instead of Promoters.
The resulting score can range from a low of -100 to a high of +100.
What a good Net Promoter Score looks like
According to our global benchmark data, which accounts for the NPS of more than 150,000 organisations, the average score is +32.
Here’s a closer look at the global benchmark numbers:
- The lower quartile of organisations (or the bottom 25% of performers) have an NPS of 0 or lower.
- The median NPS is +44. (Half of organisations have an NPS below this score and the other half have a score that’s higher.)
- The upper quartile of organisations (or the top 25% of performers) have an NPS of +72 or higher.
Comparing yourself to all of the other organisations isn’t always the best representation of how you’re doing, since the customer experience can vary (a lot) from one industry to another.
So what is a good Net Promoter Score for organisations in your space? Here’s a breakdown across three common categories: professional services (legal, financial, etc.), technology (telecommunications, computer manufacturers, etc.) and consumer goods and services (retailers, restaurants, etc.):
| Industry | Professional services | Technology companies | Consumer goods and services |
| Average NPS | +43 | +35 | +43 |
| Median NPS | +50 | +40 | +50 |
| Top quartile | +73 (or higher) | +64 (or higher) | +72 (or higher) |
| Bottom quartile | +19 (or lower) | +11 (or lower) | +21 (or lower) |
Note: You can scroll through the table to see the scores across every industry.
As you can see, organisations categorised as professional services and consumer goods and services tend to deliver a similar customer experience – minus subtle differences in their top and bottom performers – but technology companies are slightly behind in every NPS calculation.
Whether you need to catch up with your industry’s average NPS or keep a leading position, there are several ways to increase your score.
Three ways to improve your Net Promoter Score
1. Develop a systematic process for tracking your NPS and reacting to it.
The customer experience is constantly evolving. If you can keep your finger on the pulse of your customer sentiment and take steps towards addressing their feedback quickly, you’ll be more likely to have loyal, happy customers.
Learn how surveys can help you track, and act on, your NPS by reading our ultimate guide to running a customer feedback programme.
2. Give the entire team a chance to engage with customers.
Whether your colleagues are aware of it or not, their work can influence the customer experience. The better they understand their impact, the more likely they are to tailor their work to provide the best benefit to customers and your NPS.
You can empower your team to learn from customers by adopting customer interaction reports. They involve asking employees to have a conversation with a customer (as short as five minutes) and then fill out a survey to summarise the conversation. Sharing these results on a platform that any employee can access may well inspire the team and give them insight into what customers care about.
3. Invest in your customer-facing employees.
Every customer interaction shapes the client’s perception of your organisation. Prevent your organisation from losing customers by building a first-class customer-facing team. Invest in training sessions and product/service-related resources that they can refer to in order to answer customer questions as quickly and effectively as possible.
Take another look at your NPS. Now you understand how it’s calculated, how it compares to other organisations and what you can do to improve it, you can let your initial panic melt away!
NPS®, Net Promoter® & Net Promoter® Score are registered trademarks of Satmetrix Systems, Inc., Bain & Company and Fred Reichheld